Method. Microseismic Monitoring of MultiStage Hydraulic Fracturing (MHF) is a passive observation method that involves microseismic data recording, with a compact array located on the daylight surface in the epicenter of the emission source area, and further processing and analysis of the recorded microseismic events.
Data Acquisition.The applied scheme of microseismic monitoring provides control over the reservoir behavior including 24 hours monitoring before MHF and 24 hours after MHF. Mobilization time of a seismic field crew is up to 3 days, and demobilization time is one day.
Equipment. Field observations will be performed using digital seismic stations like Scout (Figure 1) or RT 2 (Figure 2) with GS-One seismic sensors. This equipment provides the following recording parameters:
- Records synchronization with maximum inaccuracy of 100 microseconds
- Sampling rate - more than 1 KHz
- Operating frequency 5- HZ
- Continuous recording time up to 28 days
The differential GPS-receiverbeing used allows measuring relative coordinates of seismic sensors with high accuracy. 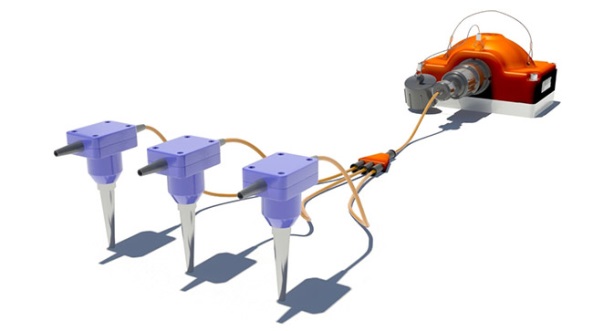
Figure 1. Three-Channel Digital Seismic Scout Station, equipped with GS-One seismic sensors.

Figure 2. Single-Channel cable-free and real-time RT2 system Data acquisition system. The antenna consists of a geophone array (the antenna aperture is approximately 1000 meters), which must be buried in the soil to a depth of 1-2 meters depending on the subsurface conditions. Key advantages of the method (Figure 3) include its flexibility, fast deployment, high resolution, low transportation and acquisition cost, and budget-friendly processing of acquired data. The distance between the sensors should be about 50 meters.
The typical acquisition array employs 400 vertical sensors and covers approximately 1000х1000 meters. With 0.5 ms sampling rate, the depth of microseismic monitoring ranges from 700 to 5000 meters.
The array has the capacity to provide MHF in 7 parallel horizontal wells with a length of 1 km, located at about 300 meters distance from each other (Figure 3)
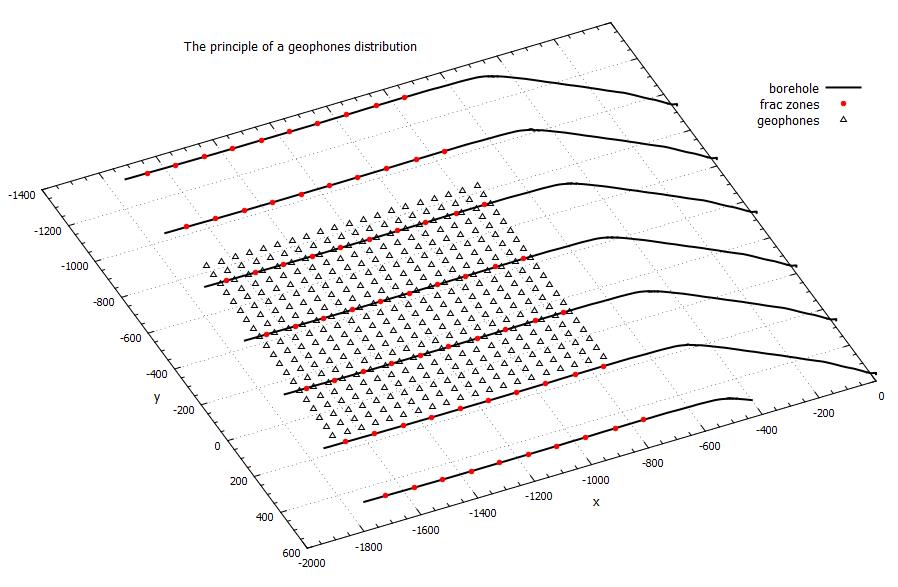
Figure 3. Data acquisition system
Tasks solved by MHF monitoring:
- Determination of the size and azimuth of fractured zone
- Visualization of fractured zone development
- Determination of energy parameters of microseismic events and injection process
- Visualization of the microseismic activity zone
- Energy density mapping
- Analysis of MHF stages based on energy parameters calculation
Monitoring results. Kinematic characteristics of the events. One of the key tasks of hydraulic fracturing monitoring is to identify the geometry of the fracturing zone that was developed during well simulation. Microseismic monitoring provides critical parameters such as length and azimuth of the fracturing zone that can be assessed with regard to the position of hypocenters of microseismic events developed during monitoring. An example of the fractured zone mapping and determination of the azimuth of the fracture volume distribution is shown in Figure 4. Additional information about the fracturing process can be obtained with visualization technologies that provide valuable insights into fractured zone formation and distribution processes using both static images (Figure 5) and time lapse video.
 Figure 4. Daylight surface projection of microseismic events induced during Substitution stage, Data Frac stage and Main Frac stage (1 port); diameter of dots representing the events corresponds to their energy; coordinate system is well-centered; color coding corresponds to recording time: purple – Substitution stage, blue – Data Frac, red – Main Fac.
Calculation of microseismic events density allows delineation of the microseismic activity zone (Figure 6). The section of this zone shows the density of microseismic energy (Figure 7).
Monitoring results.Dynamic characteristics of the events. Each microseismic event can be described by a set of parameters. Apart from the event coordinates and the occurrence time, relevant energy parameters can be calculated (absolute energy, magnitude, energy of isotropic compression/extension, energy of maximal separation/compression/shear tension, etc.) Energy parameters are calculated based on the seismic moment tensor which can be represented in the principal axes as three perpendicular vectors. Figure 8 represents microtensions distribution in the area of microseismic emission development with main tension axes directions (seismic moment tensor) during hydraulic fracturing operations. The figure shows the maximum value of the seismic moment tensor; its length is proportional to the energy.

Figure 5. Bar chart of recorded microseismic events during Main Frac stage overlaid by operational logs (red-tubing pressure, blue-annulus pressure, green-fluid flow rate, magenta- proppant concentration by density gauge, purple-pumping power).

Figure 6. Isosurface of energy density of microseismic events recorded during first MHF stage; grid size is 25 meters; isosurface contains 95% of emitted microseismic energy
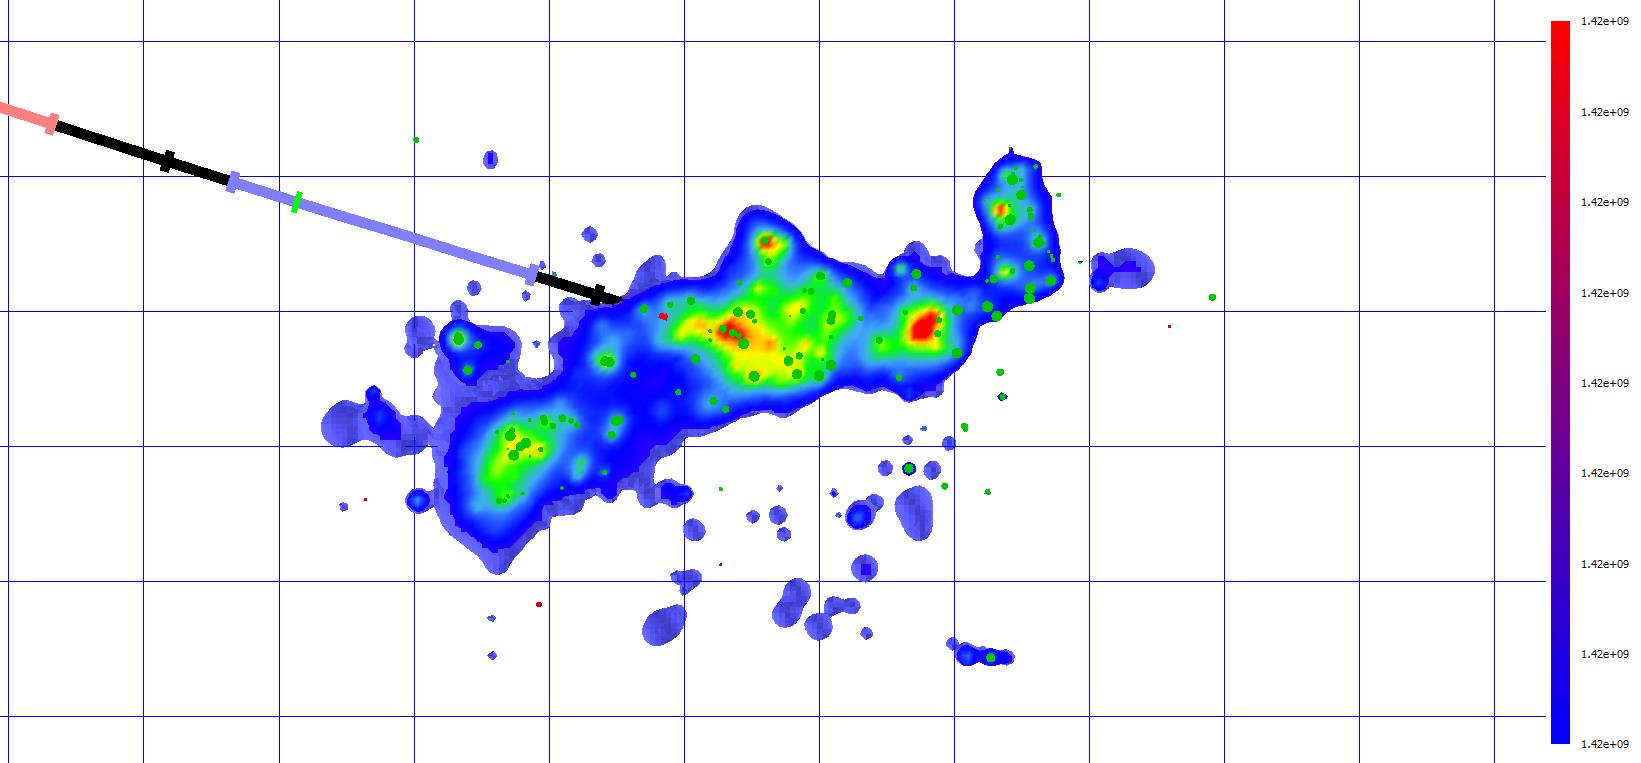
Figure 7. Horizontal slice of energy density of the microseismic events, registered in course of substitution stages, the minimal monitoring of fracturing treatment and major monitoring of fracturing treatment; grid size amounts to 25 meters
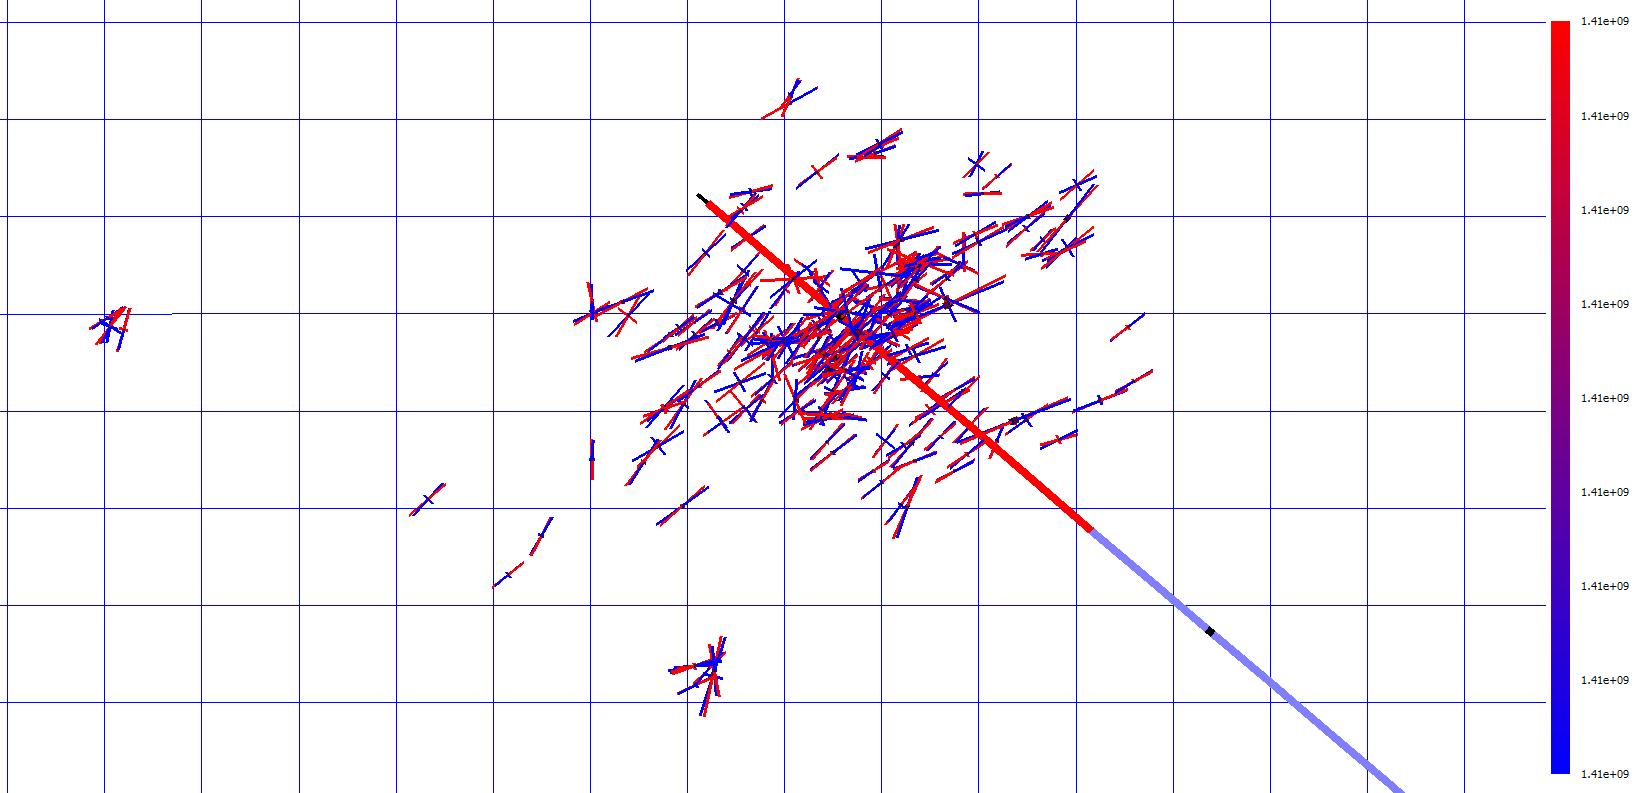
Figure 8. Direction of the main tension axes (tensor) for each microseismic event during hydraulic fracturing operations; grid size 25 meters
Comparative characteristics of the MHF stages. Pumping power is assessed using operational logs (Figure 5). The total pumping power assessment and relations of microseismic energy and total pumping power characterize various stages of the hydraulic fracturing process and allows comparison of this data. Figure 9-10 shows disproportion between isotropic compression and extension (P) energy for various MHF stages. Figure 12 shows comparative results of different stages of the 7-stage hydraulic fracturing operations.
 Figure 9. Bar chart representing percentage ratio of total emitted seismic energy and total pumping power for various MHF stages

Figure 10. Bar chart representing non-compensated part of the isotropic compression and extension (P) energy for various MHF stages
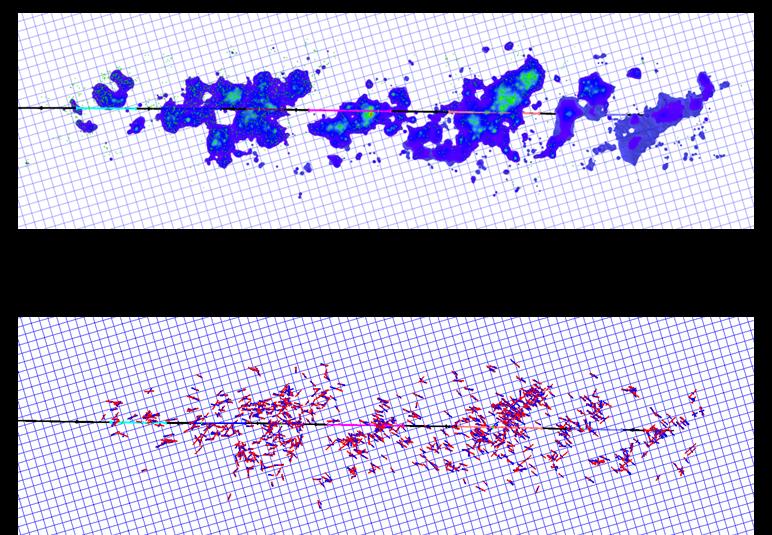
Figure 11. MHF microseismic monitoring results represented as energy isosurfaces and as horizontal projections of the main tension axes
Monitoring of filtration activity. Multistage hydraulic fracturing (MHF) in horizontal wells is a well-known technology and currently is a widespread mechanism for hydrocarbon recovery. Traditionally, microseismic monitoring is applied for source characterization of microseismic events generated during hydraulic-fracturing. However, this application does not provide information about the efficiency of each port. Passive monitoring based on MSPRM method performed after MHF (Figures 12-13) allows recording of microseismic events near the producing ports. The investigations of fluid movement profiles in the well demonstrate that the only three producing ports in this zone were the ports where microseismic activity was observed.
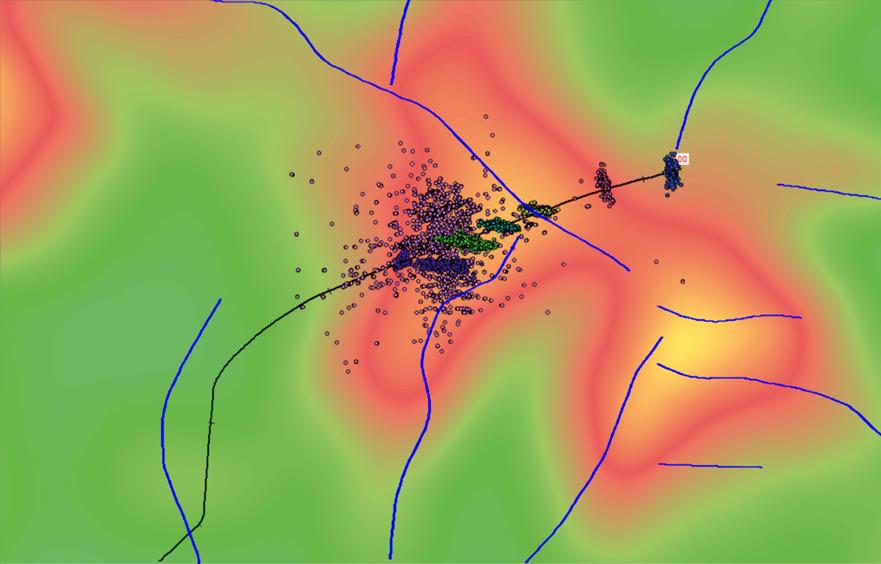
Figure 12. Structural map demonstrating faults and microseismic events recorded during MHF and passive monitoring (purple-colored). Bazhen formation.
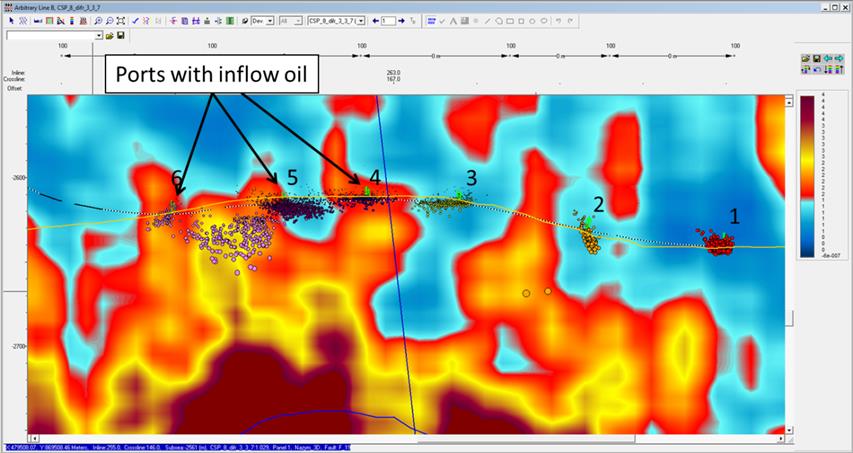
Figure 13. Scattered waves cube section along the seismic line passing through the horizontal well. Bazhen formation. The ST-FracArray technology has been tested on 45 oil fields.