Method. Microseismic monitoring of hydrocarbon deposits is a passive observation method that involves microseismic data recording, with a compact array located on the daylight surface in the epicentral area of the emission sources, and further processing of the recorded microseismic data.
Data Acquisition. The applied scheme of microseismic monitoring provides control over the reservoir behavior and injected and produced fluids volumes to maintain elevated pore pressure and increase production. Continuous observations shall be made for at least 20-day period. Mobilization time allowed for a seismic field crew is maximum 5 days, and demobilization time is 2 days.
Equipment. Field observations will be performed using digital seismic stations like Scout (Figure 1) or RT 2 (Figure 2) with GS-One seismic sensors. This equipment provides the following recording parameters:
- Records synchronization with maximum inaccuracy of 100 microseconds
- Sampling rate - more than 1 KHz
- Operating frequency 5 - 200 HZ
- Continuous recording time up to 28 days
The differential GPS-receiver being used allows measuring relative coordinates of seismic sensors with high accuracy.
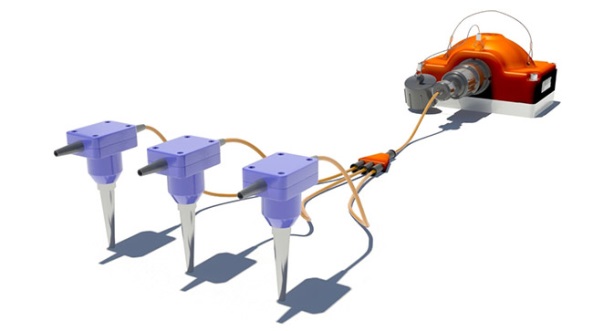
Figure 1. Three-Channel Digital Seismic Scout Station, equipped with GS-One seismic sensors.

Figure 2. Single-Channel cable-free and real-time RT2 system
Data acquisition system.
The antenna consists of a geophone array (the antenna aperture is approximately 1000 meters), which must be buried in the soil to a depth of 1-2 meters depending on the subsurface conditions. Key advantages of the method (Figure 3) include its flexibility, fast deployment, high resolution, low transportation and acquisition cost, and budget-friendly processing of acquired data. The distance between the sensors should be about 50 meters.
The typical acquisition array employs 400 vertical sensors and covers approximately 1000х1000 meters. With 0.5 ms sampling rate, the depth of microseismic monitoring ranges from 700 to 5000 meters.
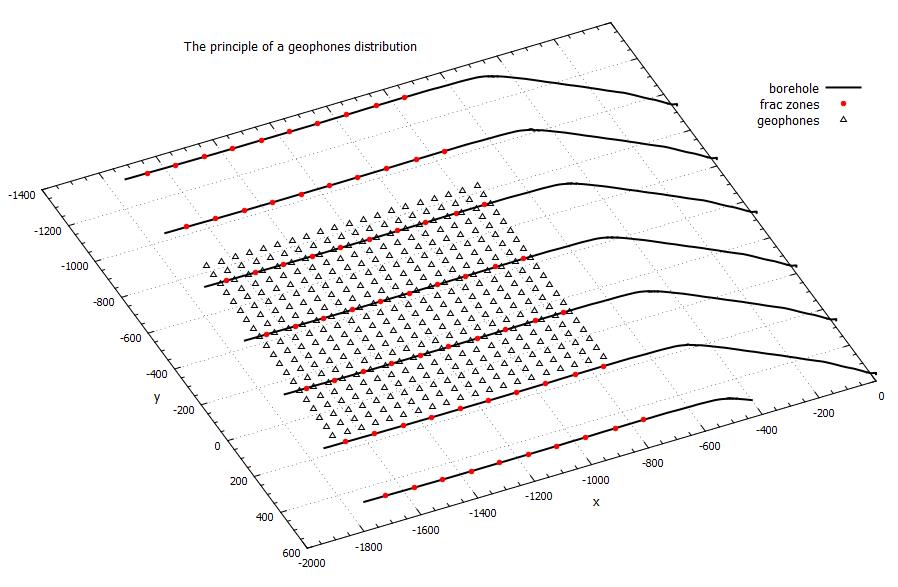
Figure 3. Data acquisition system
Tasks solved by microseismic monitoring:
- Monitoring of fluid displacement
- Location of active zones
- Identification of fault block structures
- Monitoring of filtering capacity
Monitoring of fluid displacement. Determination of event hypocenters allows observation of fluid displacement by a working agent in the vicinity of a wellbore. At the very beginning of fluid displacement we can observe the changes of seismic activity distribution dynamics over time (Figure 4), and can determine the travelling direction of fluid displacement.
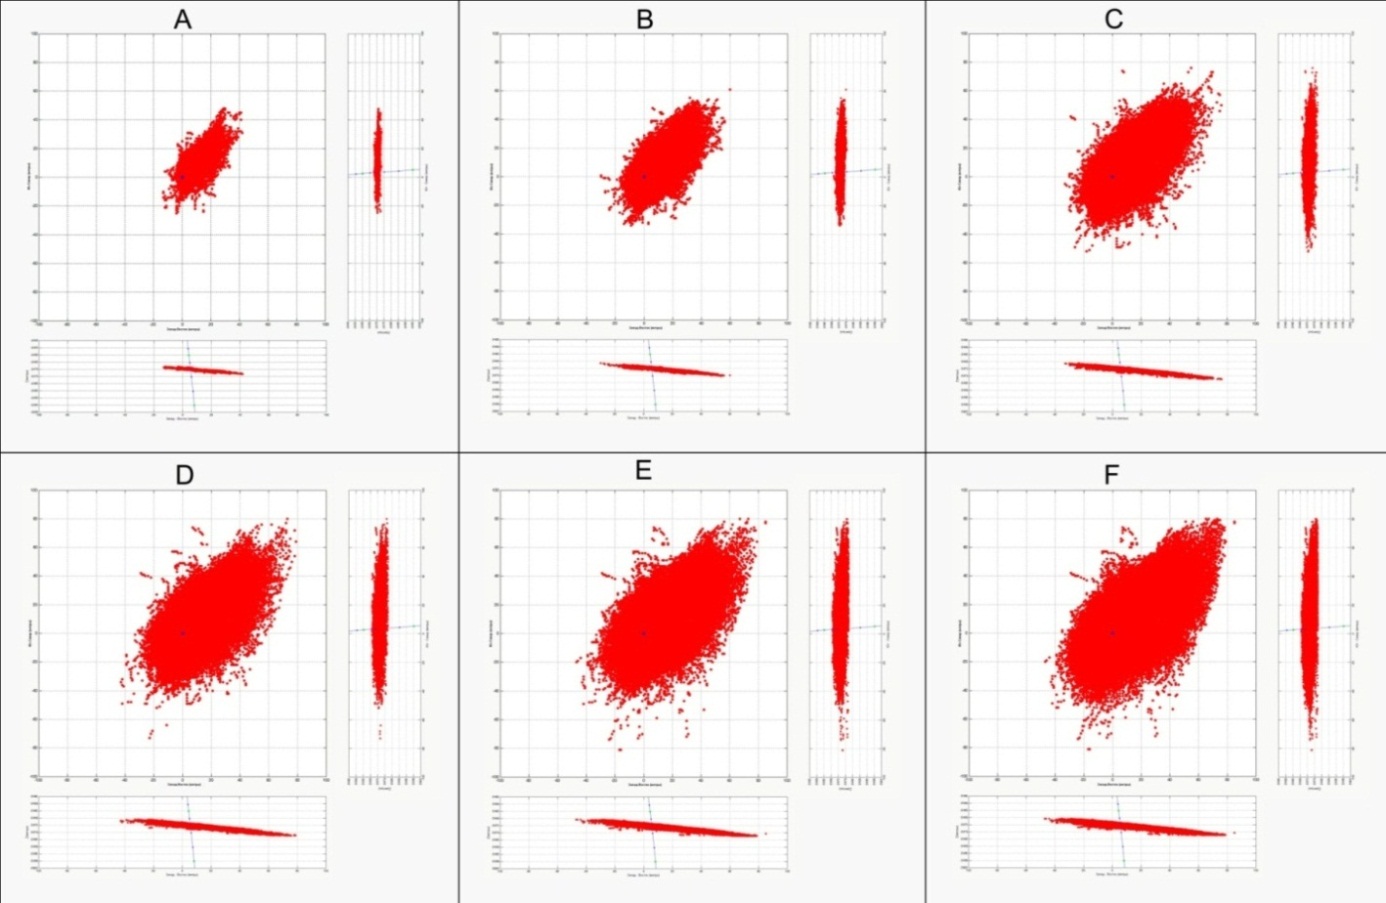
Figure 4. Snapshots of microseismic activity cloud development over a regular 100-hour interval, grid size 10 meters
Next, we obtained seismic moment tensor from amplitude inversion of microseismic data, which enabled evaluation of energy parameters of the microseismic events, and, in turn, recognition of the microseismicity patterns caused by fluid injections. Based on the time-lapse microseismic data analysis (Figure 5), the direction of injection water front movement (flood front) was determined. The microseismic events recorded during 15 days are presented in Figure 6.
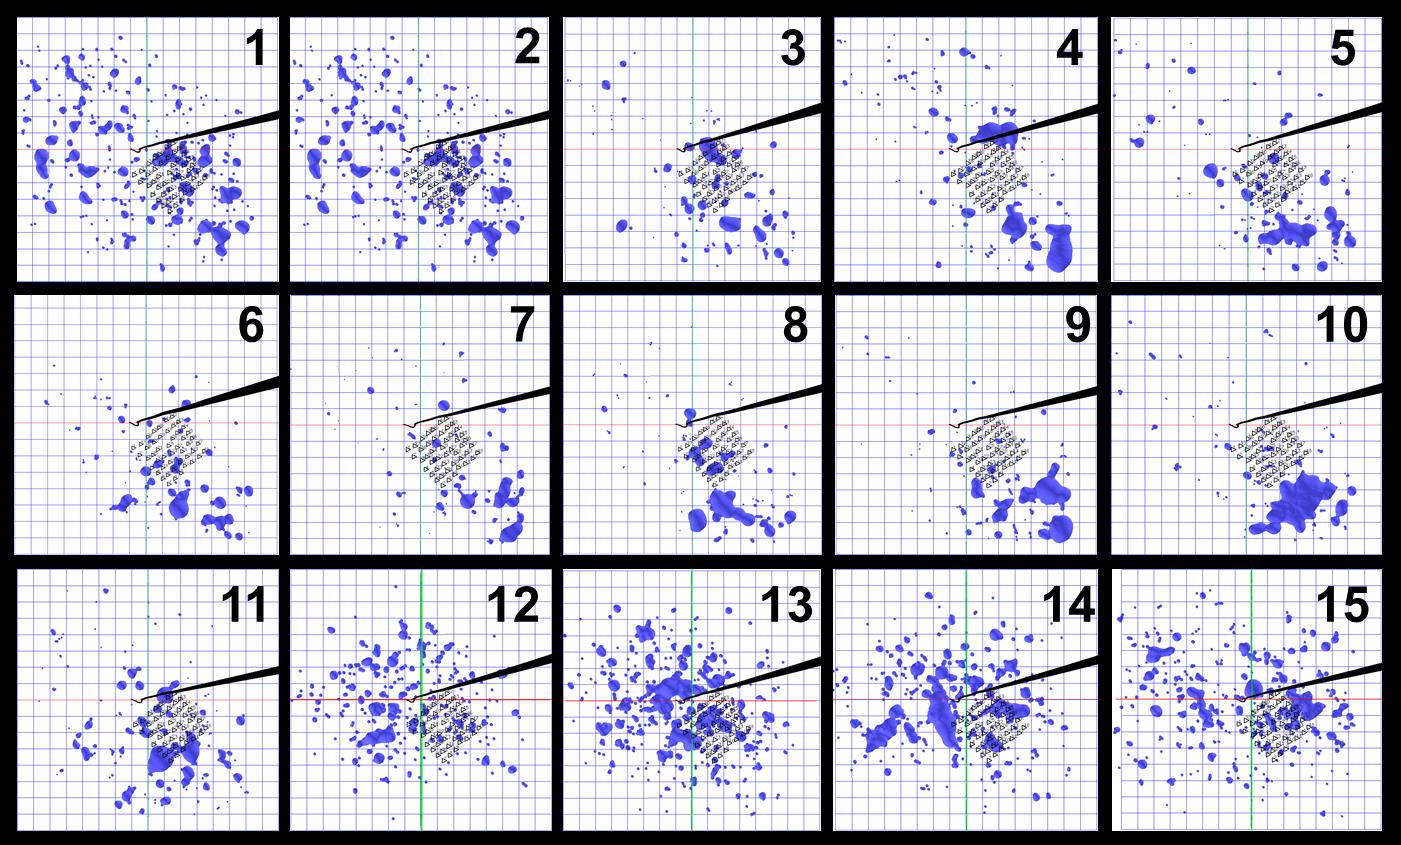
Figure 5. Daylight projection of isosurfaces of energy density pattern from microseismic events recorded in the vicinity of injection well at the hydrocarbon field during 15 days; grid size 100 m; isosurface contains 98% of the microseismic emission energy; black line – vertical borehole
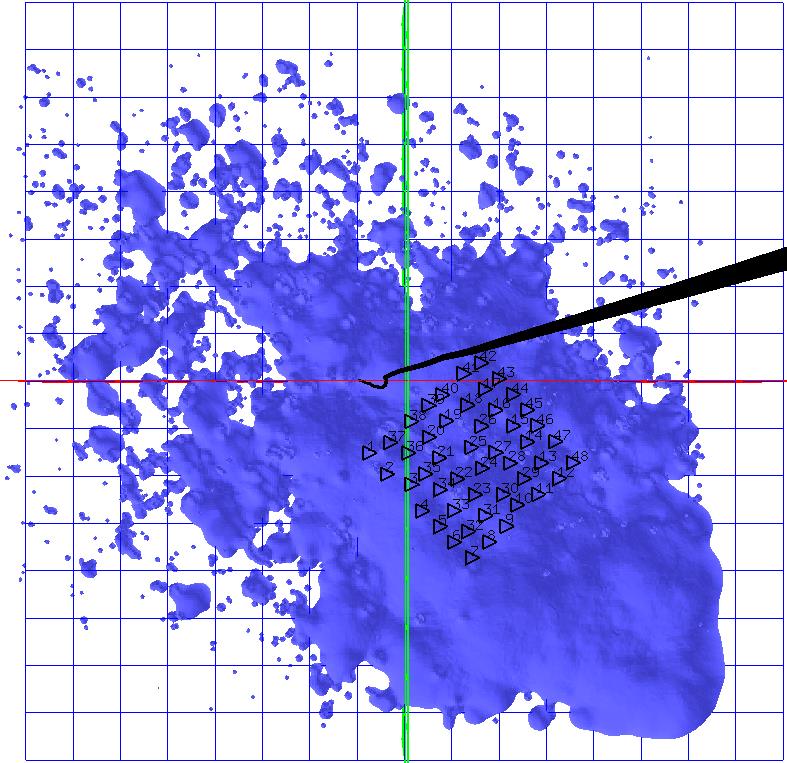
Figure 6. Isosurface of the energy density of the microseismic events registered in the zone of the injection well of the hydrocarbon deposit within 15 days of observation projected onto the daylight surface; grid size 100 m; isosurface contains 98% of the microseismic emission energy; black line – vertical bore hole
Figure 7 represents daily injection volumes and injection pressure diagrams and overlaid bar chart of non-compensated parts of deformation energy of isotropic extension (dP) and maximum adhesive tension (dSgN). Release of pressure and increase of water injection volume affects energy parameters.

a b
Figure 7. а) daily injection volumes diagram (green) and overlaid bar chart of non-compensated part of deformation energy of isotropic extension (blue). b) injection pressure diagram (purple) and overlaid bar chart of maximum adhesive tension (red)
Location of active zones. Drainage areas of producing wells at the hydrocarbon fields provides useful and important information. Figure 8 shows the area of the most intense microseismic activity occurred during production from the porous reservoir without water stimulation (by natural pressure depletion).

Figure 8. Color-coded map of producing wells drainage zone, warmer colors correspond to greater intensity of microseismic events
Identification of fault block structures. Figure 9 represents microseismic monitoring results of hydrocarbon production by natural pressure depletion in a mixed type reservoir. The fault block structure near the producing well was delineated based on previous hydraulic fracturing monitoring.
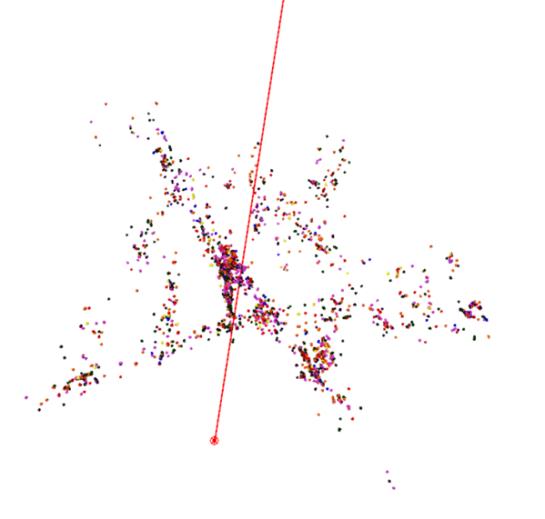
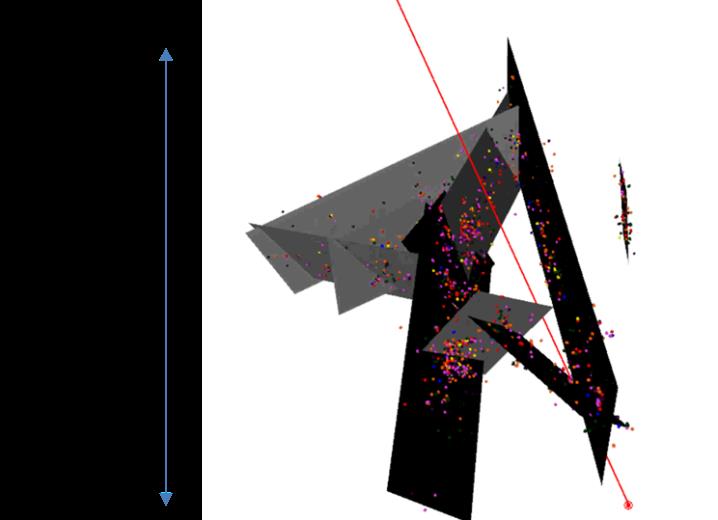
Figure 9. Microseismic events used for delineation of the fault block structure near the vertical producing well; red line – well-bore trajectory.
Monitoring of filtering capacity. Multi-stage hydraulic fracturing (MHF) in horizontal wells is a well-known technology and currently is a widespread mechanism for hydrocarbon recovery. Traditionally, microseismic monitoring is applied for source characterization of microseismic events generated during a hydraulic-fracturing, however, this application does not provide information about the efficiency of each port. Passive monitoring performed after MHF (Figures 10-11) allows recording microseismic events near the producing ports. The investigations of fluid movement profiles in the well demonstrate that the only three producing ports in this zone were the ports where microseismic activity was observed.
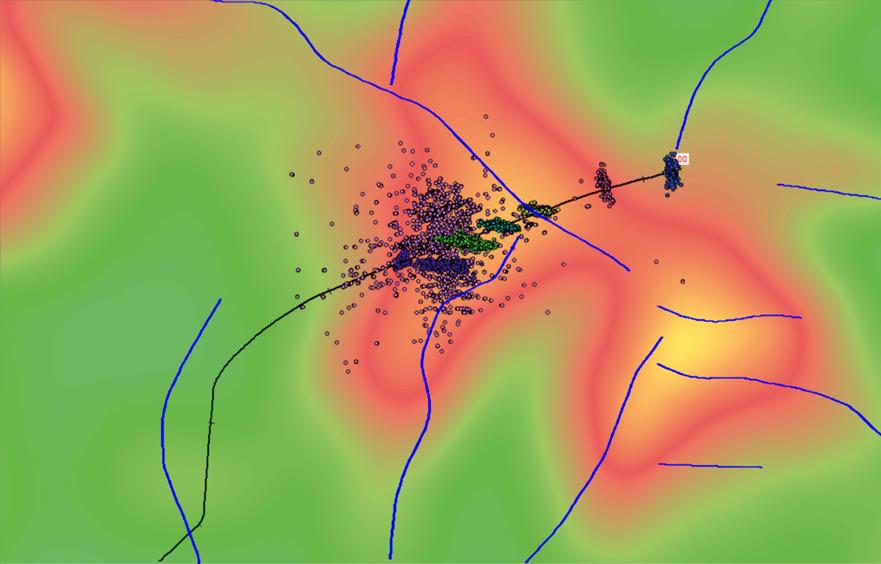
Figure 10. Structural map demonstrating faults and microseismic events recorded during MHF and passive monitoring (purple-colored). Bazhen formation.
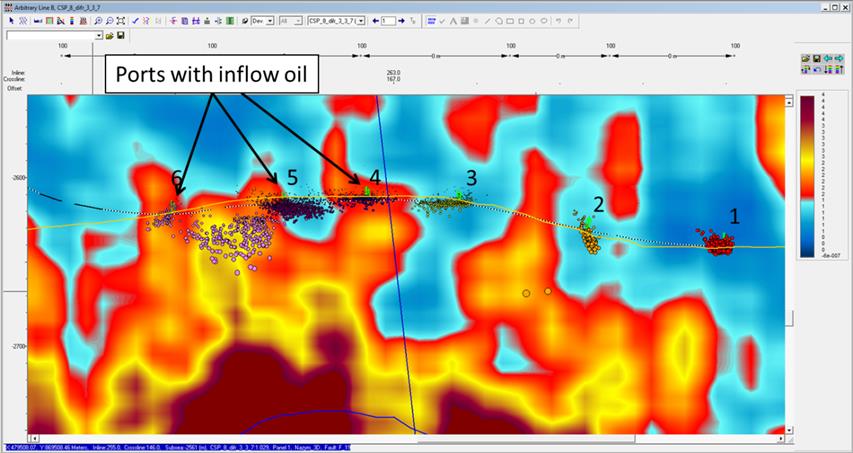
Figure 11. Scattered waves cube section along the seismic line passing through the horizontal well. Bazhen formation.
Long-Term FracArray technology has been applied on 40 oil fields.